The framework of Semiotics is helpful in explaining the intended use of my visual system for music due to the way it helps us understand how people derive and order meaning from different stimuli.
The symbols themselves are intended to serve as indexical signs. This type of sign was first described by Charles Peirce and denotes something that is indicative of something else. The most commonly used example is of smoke as an indexical sign of fire.
In the context of my visual system, the symbols are generated by the properties of the sound and thus certain patterns, combinations and structures that appear within them can be read as indexical signs of certain types of music.
On the Bestival Poster, the symbol for the song How Far (2 Bears Remix) by Totally Enormous Extinct Dinosaurs (below) contains a distinct repeated pattern of colour. Somebody who viewed this symbol and subsequently listened to the track would learn the connection between this patterned symbol and the dancey, electronic music and would be able to measure other visuals against this reference point and gradually acquire an idea of what style of symbol indicates what type of sound.
The indicative nature of the system (five key attributes define the look of each symbol so it does not wholly describe each track) is conducive to intuitive guessing of what things might sound like and acts like a rough guide for an educated exploration of music where the listener isn't influenced to receive the music in a certain way by superfluous marketing and branding.
Showing posts with label thought. Show all posts
Monday, 2 May 2011
Monday, 18 April 2011
Post 21- Edward Tufte
Though I am not creating 'infographics' in my system for visualising music, (read the post on Isotype charts) I followed up a reference in Erik Spiekermann's book review (mentioned in the Isotype post) to Edward Tufte.
Tufte is an influential thinker in the field of information design who advocates a selective approach to data-based design with the elimination of any elements that do not contribute to the audience's understanding of the implications of that data (this is summed up by his term, 'chartjunk').
One idea that he is an exponent of, summarised on his Wikipedia page, struck me as being salient in general and particularly relevant to this project:
These sound like a good set of guidelines for visualising music, as I think to be able to compare the sounds visually with one another, my symbols will need to be adept at showing overall trends and patterns.
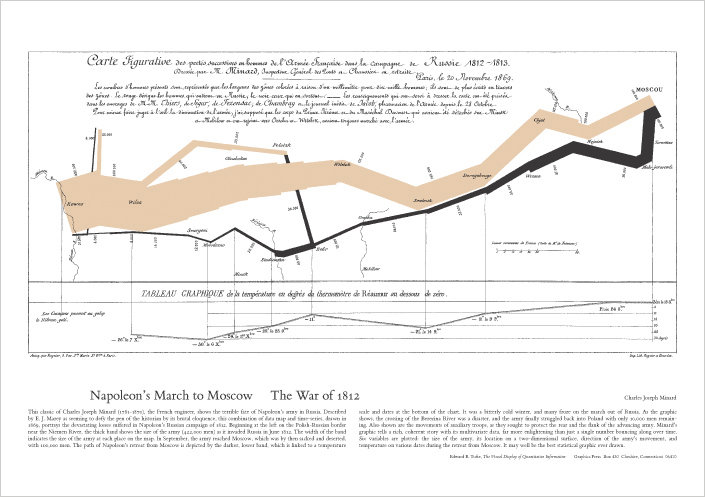
Below is an example of what Tufte brands 'the best statistical graphic ever drawn', a diagram of Napoleon's Russian campaign and subsequent retreat that gives the viewer a laconic insight into the fortunes of the campaign with the width of the line representing the dwindling number of men in his army.
Tufte is an influential thinker in the field of information design who advocates a selective approach to data-based design with the elimination of any elements that do not contribute to the audience's understanding of the implications of that data (this is summed up by his term, 'chartjunk').
One idea that he is an exponent of, summarised on his Wikipedia page, struck me as being salient in general and particularly relevant to this project:
Tufte also encourages the use of data-rich illustrations with all the available data presented. When examined closely, every data point has value; when seen overall, trends and patterns can be observed. Tufte suggests these macro/micro readings be presented in the space of an eyespan, in the high resolution format of the printed page, and at the unhurried pace of the viewer's leisure
These sound like a good set of guidelines for visualising music, as I think to be able to compare the sounds visually with one another, my symbols will need to be adept at showing overall trends and patterns.
Below is an example of what Tufte brands 'the best statistical graphic ever drawn', a diagram of Napoleon's Russian campaign and subsequent retreat that gives the viewer a laconic insight into the fortunes of the campaign with the width of the line representing the dwindling number of men in his army.
Post 20- Transforming data into human stories
Erik Spiekermann's review of the book The Transformer: The Principles of Making Isotype Charts in Eye magazine makes some pretty pertinent points about the process of encoding data in graphics. The subject of the book he reviews is Otto Neurath's work in developing a style of data presentation which maintained the connection between the actual data being shown and the visual. The principles of Neurath's Isotype charts advocate the tailoring of the visual to the data it is representing to create a piece which can be understood as intuitively as possible.
A crucial difference between my visual system and infographics is that the symbols are not intended to be transcriptions of the absolute music data which you could read a key to understand, rather they are a visual language for comparison and observation to be understood in relation only to one another.
The arbitrary nature of languages means that the symbols created by my system could take nearly any form, as long as they make differences apparent.
However, to give the user of the system some clues as to what is being signified in specific differences I will firstly draw on existing visual language and, more importantly, give them some reference points for translation in the form of well-known songs visualised through the system in the contexts in which my symbols will appear.
Neurath developed the notion of ‘the transformer’, as Robin Kinross writes in his preface, ‘to describe the process of analysing, selecting, ordering, and then making visual some information, data, ideas, implications’.
A crucial difference between my visual system and infographics is that the symbols are not intended to be transcriptions of the absolute music data which you could read a key to understand, rather they are a visual language for comparison and observation to be understood in relation only to one another.
The arbitrary nature of languages means that the symbols created by my system could take nearly any form, as long as they make differences apparent.
However, to give the user of the system some clues as to what is being signified in specific differences I will firstly draw on existing visual language and, more importantly, give them some reference points for translation in the form of well-known songs visualised through the system in the contexts in which my symbols will appear.
Sunday, 17 April 2011
Post 7- The Paradox of Choice
With the advent of the music streaming services such as Spotify, Last.fm and Grooveshark, it has become possible to access millions of tracks within seconds. On paper, these services would appear to be a great tool for music discovery as you can flit seamlessly between any number of songs. However it is often the case that I'll open Spotify and find I'm unable to commit to choosing music to listen to simply because of the sheer number of options.
When I brought up this point at a group tutorial it seemed that others also experienced this inability to choose. We are not alone either, I wanted to look deeper into whether the number of available options has an effect on our decision making abilities generally and, on Googling 'too much choice' I found that a discourse had been opened which posits that it does.
The key proponent of this idea is psychologist Barry Schwartz, whose book The Paradox of Choice: Why More is Less describes how an abundance of choice in almost all aspects of western, consumer societies has led to more anxiety about our choices, and a hesitancy to make them for fear that we will regret our decision and dwell on what may have happened had we made a different choice.
He sums his theory up in this TED talk, citing some pretty compelling evidence and personal anecdotes that I found pretty relatable. You may choose to watch it....
Post 5- Eclectism
The flaws that make stats based music recommendation systems so skewed and limited made me start to consider what, if anything, exists to help people genuinely discover new music. On reflection, one of the richest veins of new music I have come across is Gideon Coe's BBC 6music show. Gid's shows are a marked by a playlist of tracks from a complete myriad of genres and time periods (it's not unusual to hear metal, reggae, folk and swing represented in a single show) framed by the friendly, relaxed atmosphere created by the presenter's affability and dry humour.
I'm sure it is no coincidence that I find more new music through listening to this show than anywhere else (from genres and time periods that, left to my own devices, I would never consider exploring) and that the show is delivered in such a mellow, disarming manner. This, I think, makes the audience generally more receptive to the unfamiliar sounds thus allowing for the genuine discovery of new music, as opposed to finding artists that are unreliably branded as 'related' to one you already like.
Perhaps the aim of my project should not be finding the best way to help people find new music they like, perhaps it is to help facilitate a change of attitude to the kind of open-minded, non-judgemental one which Gideon Coe's shows manage to evoke that make it possible to derive pleasure from listening to almost anything.
Give the show a listen here, or tune in to 6 music from 9-12pm on weeknights, it's an especially good show to get you through those work sessions where midnight oil may be burned.
Post 3- Music Recommendation Systems
After realising the limitations that are inherent in any music recommendation system, a refocusing of the project was needed. Why did I want to create a visual music recommendation system in the first place?
The simple answer was that I often got bored of my music or drew a blank when I opened Spotify, wanted to find new, exciting stuff to listen to and found that most of the things that are designed to help do this were pretty unhelpful.
They would often throw up some odd, tenuously linked artist to the one I had started out from. A case in point are the band Biffy Clyro who I have followed from their 2nd album in 2004. They have cited their influences as being from grunge and prog-rock and have been subject to comparisons to artists such as Nirvana, The Pixies, Rush and Fugazi who also used to be among their 'related artists' on Spotify. After their most recent and most popular album though, Nirvana etc have been supplanted by the artists that their new, bigger mainstream fanbase also listen to, so they are now supposedly 'related' to Florence and The Machine, Mumford and Sons and Plan B.
These comparisons say little about the music itself, they are determined by factors like how the band is marketed, which magazines and radio shows feature them and which type of listener takes ownership of them. Thus, unless you are the type of listener who conspicuously consumes music to identify yourself with the groups that are moulded by marketing, these features are not of much use.
Post 1- Original Concept.
The original brief I set myself was to create a music recommendation system that was fully visualised. I envisaged a set of visual symbols that would be created by the very music that they represented through a generative visual system taking in various aspects of data from it. You would then be able to get an intuitive, immediate overview of different pieces of music and compare or relate those to others.
In contrast to the majority of recommendation systems that base their recommendations on dominant listening trends and patterns, (such as Amazon and Spotify) this system would be rooted in the actual sound properties of a piece of music and so would be closer to Pandora, though less comprehensive (Pandora aggregates 400 characteristics for each song) and more indicative.
However, at the point where I started to actually break music down into data and translate this into visuals, I realised just how reductive this process was and, crucially, how no amount of quantitative data (not even 400 characteristics per song) would be able to define an atmosphere, sentiment or meaningfully pre-empt the subjective, esoteric intangible that is personal taste. As a friend summarised neatly in a conversation about my idea, we don't like music because it has X beats per minute- "its just a whim".
Subscribe to:
Posts (Atom)