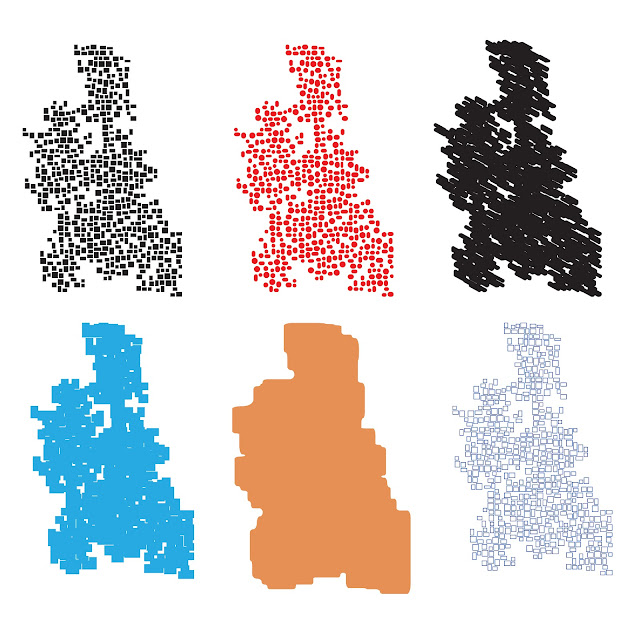
The first visual tests I did were based on an idea that the song data should be able to generate a distinctive shape. I tried to think of other ways of doing this than just an X, Y coordinate system, where the value determined the placement of a series of points which would be joined to create this shape. I tried out some web-like patterns but as pretty and organic as they looked, they all ultimately resembled mesh-like patterns and would have been pretty hard to compare with one another as the data was visualised only in very fine detail.
Next I tried a method of taking a shape and using data (which at this point was placeholder data of random numbers from the really useful and interesting site Random.org as I had yet to find out how to extract data from music) to determine the placement of it in relation to the previous shape (eg for a square, if x=3 then place the next square adjacent to side 3). This required some more complex rule-making but produced some interesting, clustered formations of shapes. However, this rule eventually failed when it became apparent that two songs with the same data except for 1 value could end up looking very different as each value had a big impact on altering the course of the shape development.


No comments:
Post a Comment